


 o recapitulate: the T1 relaxation time is the time required for the system to recover to 63% of its equilibrium value after it has been exposed to a 90° pulse. To measure this time, several different radio frequency pulse sequences can be employed.
This pulse sequence is the most simple sequence in magnetic resonance. It is also called saturation recovery pulse sequence, although the latter sequence differs from partial saturation by longer repetition times.
At time zero the equilibrium magnetization M₀ is exposed to a 90° pulse.
It tips down the magnetization into the x'-y' plane. After a delay time, called repetition time (TR), the spin system is exposed to a second 90° pulse (Figure 04-07), which again brings the magnetization down in the x'-y' plane so that the FID can be monitored.
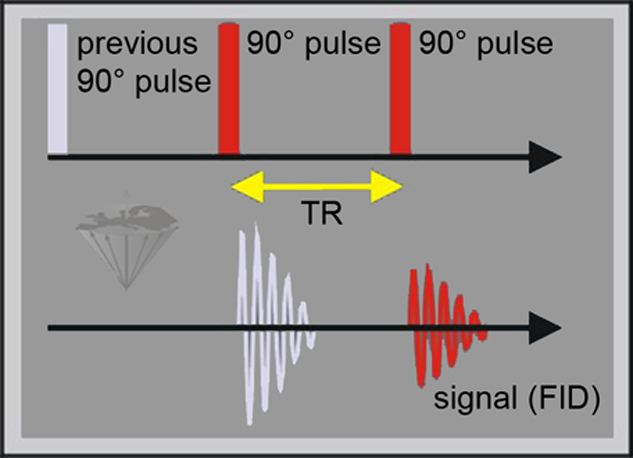
Figure 04-07:
Pulse sequence diagram of a partial saturation sequence, consisting of 90° pulses. The time between the pulses is called repetition time, TR. When TR is not long enough for the spins to return completely to the equilibrium (i.e., TR < 5×T1), the signal intensity of the FID is lower than the maximal signal intensity possible.
If TR is equal to or greater than 5×T1, the magnetization in the x'-y' plane is equal to M₀.
However, if TR is comparable to T1, relaxation will be incomplete, leading to an observable magnetization smaller than M₀ (Figure 04-08).
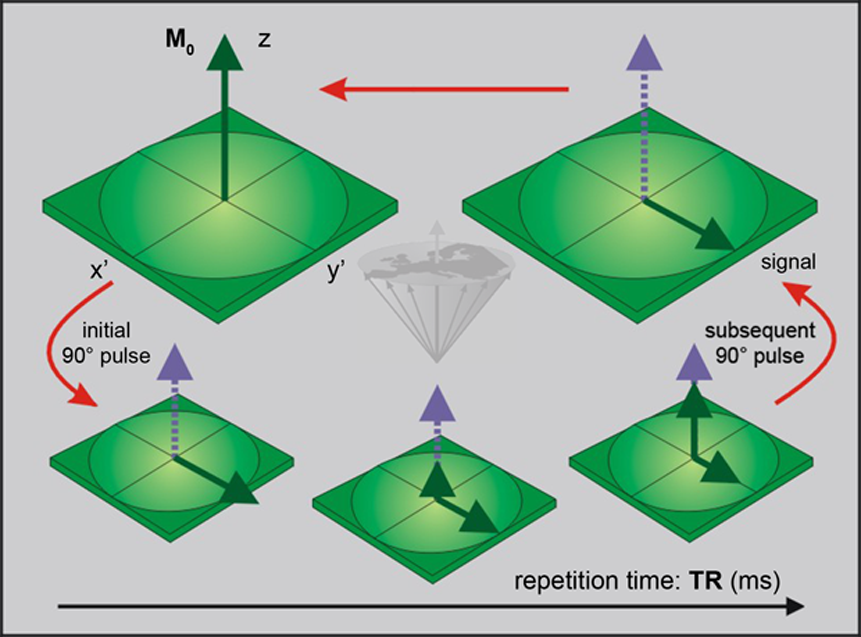
Figure 04-08:
Partial saturation sequence: The magnetization M₀ is tipped by a 90° pulse.
During the repetition time, TR, the system will relax and magnetization will start its return to the equilibrium state. To monitor the size of the magnetization, the system is exposed to a second 90° pulse.
The time dependence of Mz (the z-magnetization which equals the signal intensity) on TR, Mz(TR), can be studied by introducing a range of fitting repetition times TR. In the simplest case, the return to equilibrium is a mono-exponential function:
Thus, it is understandable that if the system is being re-excited at a repetition time TR smaller than 5×T1, the recorded magnetization is less than the maximum value M₀. How much less depends on the ratio of TR over T1.
This effect can be utilized to great advantage if different substances in a given sample have different T1 values. It is possible to reduce part of the signal emerging from the sample, for instance to suppress the signal emerging from fatty tissue. Also, different samples respond very differently to a train of equidistant 90° pulses (Figures 04-09 and 04-10). This is the basis for TR-influenced contrast behavior in MR imaging.
Thus, it is understandable that if the system is being re-excited at a repetition time TR smaller than 5×T1, the recorded magnetization is less than the maximum value M₀.
How much less depends on the ratio of TR over T1. This effect can be utilized to great advantage if different substances in a given sample have different T1 values. It is possible to reduce part of the signal emerging from the sample, for instance to suppress the signal emerging from fatty tissue. Also, different samples respond very differently to a train of equidistant 90° pulses (Figures 04-09 and 04-10). This is the basis for TR-influenced contrast behavior in MR imaging.
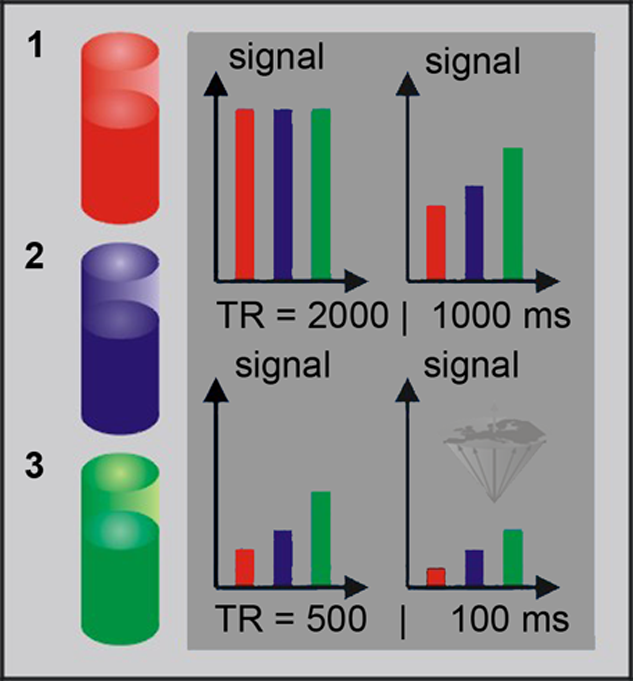
Figure 04-09:
Three different samples, (1) blood, (2) muscle, and (3) fat, assumed to have identical amounts of hydrogen but decreasing relaxation times, are exposed to a train of pulses with different repetition times TR. Note that the blood sample shows the most pronounced saturation behavior, since it has the longest T1.
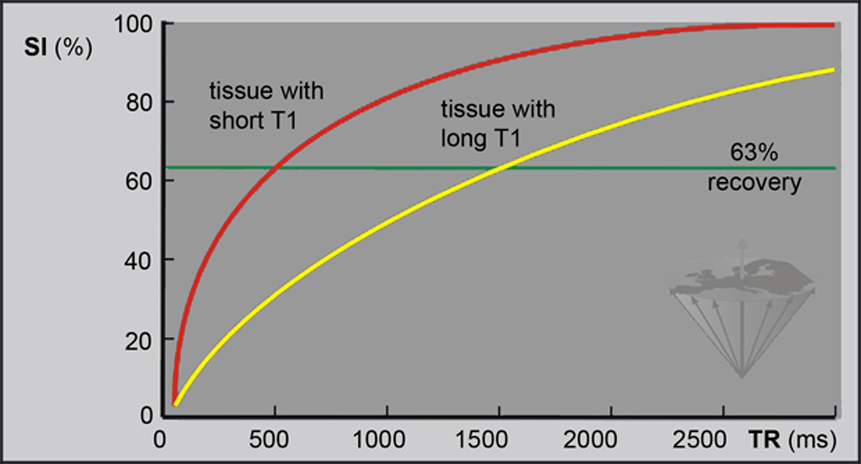
Figure 04-10:
The relative signal intensity (SI) in a partial saturation experiment. TR is the repetition time between two 90° pulses. Two different tissues with T1 relaxation times of 500 and 1500 ms, respectively, are shown. The signal recovery is 63% after a period of T1.
Partial saturation as described here is only used in a modified form in clinical imaging, namely with the incorporation of a gradient echo. This corresponds to a FLASH imaging sequence which will be discussed at a later stage.
If a spin at equilibrium is subjected to a 180° pulse, the sum magnetization M₀ is inverted with respect to the direction of the external field and becomes antiparallel to the main magnetic field. Following the inversion, the magnetization starts to recover towards its equilibrium state. The recovery rate is determined by T1.
If we expose the system to a 90° pulse after a certain delay time, the inversion time (TI), the actual magnetization Mz(TI) will become observable in the x'-y' plane as an FID.
By applying a range of different delay times, the time dependence of magnetization, and thus the signal of the inversion time, can be studied in detail. Once again, after a delay time of approximately 5×T1, the magnetization is back to equilibrium.
This 180°-90° pulse sequence is called an inversion recovery sequence (Figures 04-11 and 04-12).
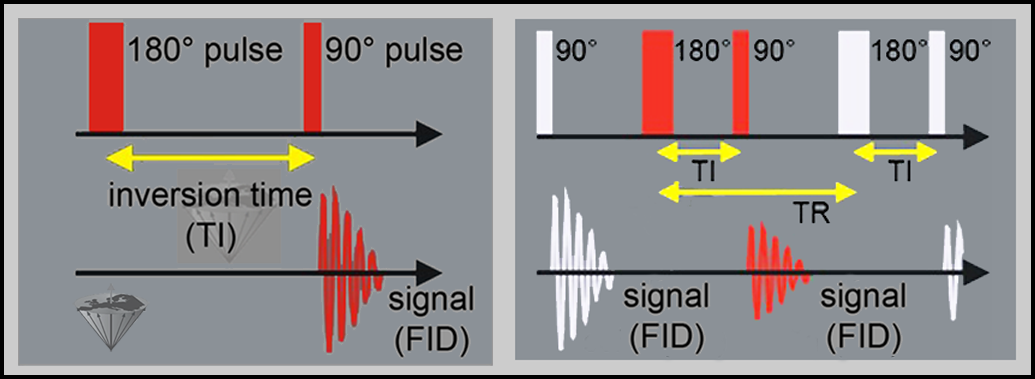
Figure 04-11:
Pulse sequence diagram of an inversion-recovery sequence.
Left: The 180° inversion pulse inverts the magnetization. During the inversion delay (TI), the magnetization recovers at a rate determined by the T1 of the sample. At a certain point during recovery, a 90° pulse is applied and the resulting signal is measured.
Right: The time between the 180° pulse and the following 180° pulse is called repetition time, TR.
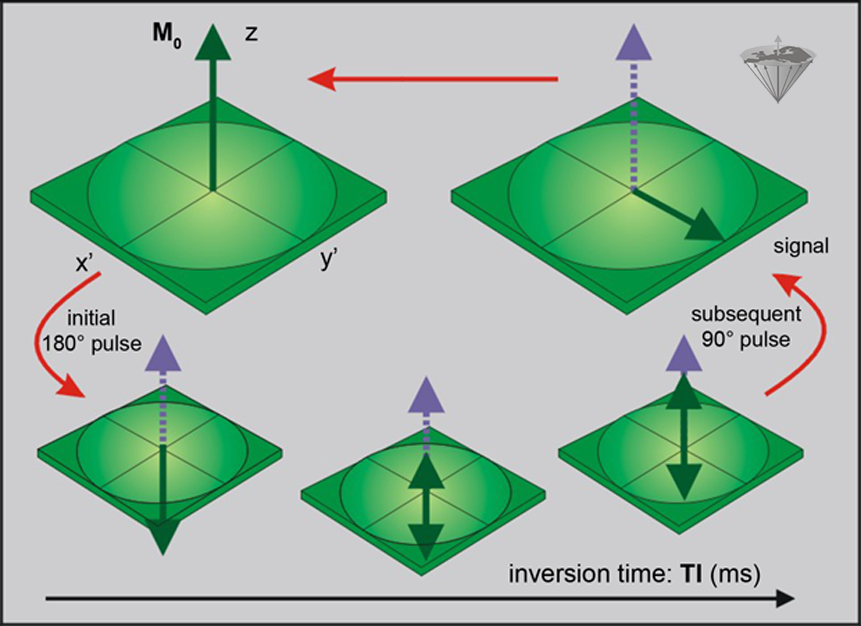
Figure 04-12:
Inversion-recovery sequence: The magnetization is inverted by a 180° pulse.
During the delay time TI, the system will relax and magnetization will start its return to the equilibrium state. To monitor the size of the magnetization, the system is exposed to a 90° pulse, which tips the magnetization into the x'-y' plane and converts the magnetization into signal.
In the simplest case, the return to equilibrium is a mono-exponential function:
The development of the signal intensity is depicted in Figure 04-13. When TR is not long enough for the spins to return completely to the equilibrium (i.e. TR < 5×T1), the signal intensity (SI) is lower than the maximal intensity possible.
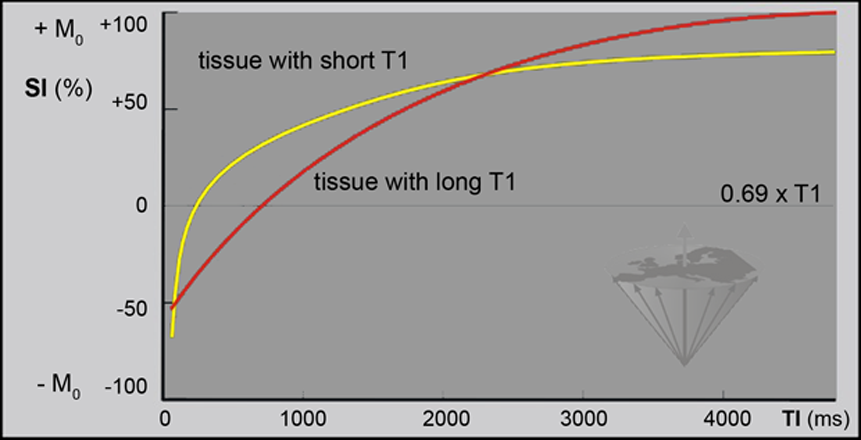
Figure 04-13:
The relative SI measured in an IR experiment as a function of TI, the time between the 180° pulse and the 90° pulse. Note that Mz = 0 for TI = 0.69×T1 (in this example two tissues with T1 = 500, ρ = 72% and 1500 ms, ρ = 100%, respectively; TR = 2000 ms).
The relative SI measured in an IR experiment is a function of TI, the time between the 180° pulse and the 90° pulse. As with the partial saturation pulse sequence, signal intensity also depends on the repetition time TR. In the case of the IR sequence, the repetition time is the time between the 180° pulses.
It is advisable to choose a TR at least 3×T1 of the tissue of interest to allow for recovery of the longitudinal relaxation of that tissue, thereby avoiding a reduction in signal intensity.
In analytical chemistry, inversion-recovery is applied as a 180°-90° pulse sequence; the initial amplitude of the FID is proportional to the value of the net magnetization at the time of the measurement.
In MR imaging, the sequence is commonly adjusted to the needs of creating an image and, for instance, combined with a spin-echo pulse sequence.


|
Chapter 4 — Page 3 |

|
|---|